The figure given below depicts the negatively sloped demand and positively sloped supply curves of wheat in a country.Figure 21.2
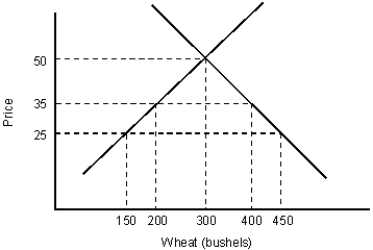
-In Figure 21.2, if the world price of wheat is $35 and a $15 tariff is imposed:
A) domestic consumption will decrease from 400 to 350 bushels of wheat.
B) the government will collect $200 in revenue from the tariff.
C) domestic consumption will increase from 150 to 200 bushels of wheat.
D) there will be no trade, and the domestic equilibrium quantity will prevail.
E) domestic price for wheat will be higher than its world price.
Correct Answer:
Verified
Q49: The figure given below depicts the negatively
Q50: The figure given below depicts the negatively
Q51: The figure below shows the demand (D)
Q52: The figure below shows the demand (D)
Q53: The figure given below depicts the negatively
Q55: The figure below shows the demand (D)
Q56: The figure below shows the demand (D)
Q57: The figure below shows the demand (D)
Q58: The figure given below depicts the negatively
Q59: The figure given below depicts the negatively
Unlock this Answer For Free Now!
View this answer and more for free by performing one of the following actions

Scan the QR code to install the App and get 2 free unlocks

Unlock quizzes for free by uploading documents