Multiple Choice
Table 5.4 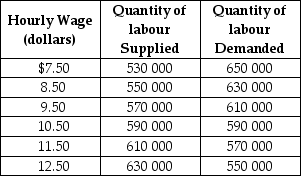 Table 5-4 shows the demand and supply schedules for labour market in the city of Pixley.
-Refer to Table 5.4.Suppose that the quantity of labour demanded increases by 40 000 at each wage level.What are the new free market equilibrium hourly wage and the new equilibrium quantity of labour?
A) W = $8.50; Q = 550 000
B) W = $12.50; Q = 630 000
C) W = $9.50; Q = 570 000
D) W = $11.50; Q = 610 000
Correct Answer:
Verified
Related Questions
Q99: The graph below represents the market for
Q100: Which statement is true when a competitive

