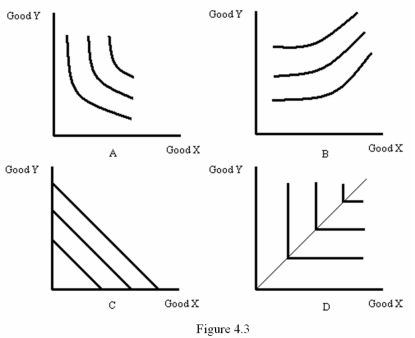
-Refer to Figure 4.4.Which diagram most likely represents the indifference map for a good and a "bad"?
A) A
B) B
C) C
D) D
Correct Answer:
Verified
Q35: The slope of an indifference curve tells
Q36: The rate at which a consumer will
Q37: Rates of substitution are determined by
A) The
Q38: Intuitively,the marginal rate of substitution for X
Q39: Two products are perfect complements if
A) A
Q41: Felix always consumes exactly four cookies with
Q42: Information about preferences is ordinal if
A) The
Q43: When there is a high degree of
Q44: Ultimately,the opportunity for mutually beneficial trade between
Q45: If Anne receives more satisfaction as she
Unlock this Answer For Free Now!
View this answer and more for free by performing one of the following actions

Scan the QR code to install the App and get 2 free unlocks

Unlock quizzes for free by uploading documents