Narrbegin Exhibit 5.3 Supply and demand curves for good X 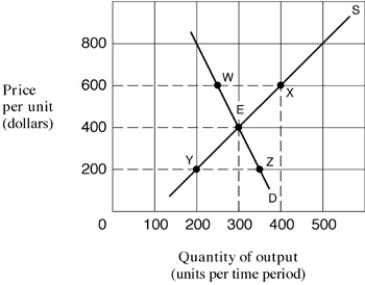
-In Exhibit 5.3, the price elasticity of supply for good X between points Y and E is:
A) 1/5 = 0.20.
B) 5/3 = 1.66.
C) 3/5 = 0.60.
D) 1.
Correct Answer:
Verified
Q108: Narrbegin Exhibit 5.4 Supply and demand curves
Q109: Narrbegin Exhibit 5.3 Supply and demand curves
Q112: Tax incidence means that:
A) the government increases
Q113: If the elasticity of demand is infinite,
Q115: The imposition of a tax on the
Q117: Narrbegin Exhibit 5.4 Supply and demand curves
Q118: Inelastic demand is a change of less
Q247: If a 10 percent price increase causes
Q253: A horizontal demand curve indicates perfectly elastic
Q264: Other factors held constant, if there are
Unlock this Answer For Free Now!
View this answer and more for free by performing one of the following actions

Scan the QR code to install the App and get 2 free unlocks

Unlock quizzes for free by uploading documents