The following graphic of residential housing data (selling price and size in square feet) indicates _____________. 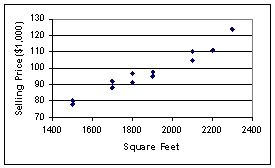
A) an inverse relation between the two variables
B) no relation between the two variables
C) a direct relation between the two variables
D) a negative exponential relation between the two variables
E) a sinusoidal relationship between the two variables
Correct Answer:
Verified
Q63: Suppose a market survey of 200 consumers
Q64: Suppose a market survey of 200 consumers
Q65: The staff of Ms.Tamara Hill,VP of Technical
Q66: A recent survey of U.S.automobile owners showed
Q67: The staffs of the accounting and the
Q69: According to the following graphic,the most common
Q70: The 2010 and 2012 market share data
Q71: The following graphic of residential housing data
Q72: The 2010 and 2012 market share data
Q73: The 2010 and 2012 market share data
Unlock this Answer For Free Now!
View this answer and more for free by performing one of the following actions

Scan the QR code to install the App and get 2 free unlocks

Unlock quizzes for free by uploading documents