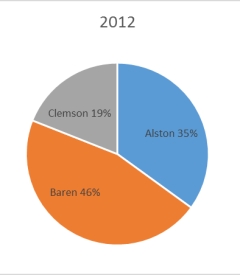
The 2010 and 2012 market share data of the three competitors (Alston,Baren,and Clemson) in an oligopolistic industry are presented in the following pie charts. Total sales for this industry were $1.5 billion in 2010 and $1.8 billion in 2012.Clemson's sales in 2010 were ___________. 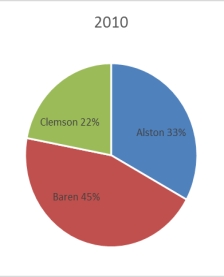
A) $342 million
B) $630 million
C) $675 million
D) $828 million
E) $928 million
Correct Answer:
Verified
Q65: The staff of Ms.Tamara Hill,VP of Technical
Q66: A recent survey of U.S.automobile owners showed
Q67: The staffs of the accounting and the
Q68: The following graphic of residential housing data
Q69: According to the following graphic,the most common
Q71: The following graphic of residential housing data
Q72: The 2010 and 2012 market share data
Q73: The 2010 and 2012 market share data
Q74: The United Nations Development Programme website provides
Q75: The following is a bar chart of
Unlock this Answer For Free Now!
View this answer and more for free by performing one of the following actions

Scan the QR code to install the App and get 2 free unlocks

Unlock quizzes for free by uploading documents