The United Nations Development Programme website provides comparative data by country on key metrics,such metrics as life expectancy over time.The chart below shows data on life expectancy over time in the United States. 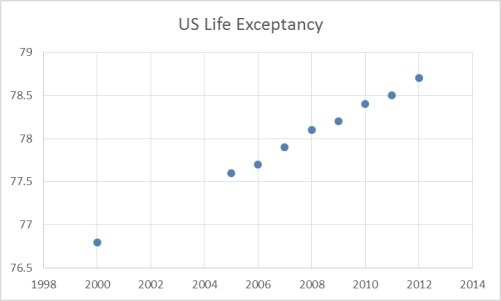 Which of the following statements are not true based on the scatterplot of U.S.Life Expectancy over time?
A) The life expectancy in the U.S.is increasing over time.
B) U.S.citizens lived fewer years in 2010 than they did in in 2008.
C) The scatterplot shows an increasing trend in life expectancy in the U.S.
D) Based on the scatterplot,one can assume the life expectancy in 2014 will be higher than 78 years.
E) All of these statements are true.
Correct Answer:
Verified
Q69: According to the following graphic,the most common
Q70: The 2010 and 2012 market share data
Q71: The following graphic of residential housing data
Q72: The 2010 and 2012 market share data
Q73: The 2010 and 2012 market share data
Q75: The following is a bar chart of
Q76: The staff of Ms.Tamara Hill,VP of Technical
Q77: The following graphic of PCB Failures is
Q78: A recent survey of U.S.automobile owners showed
Q79: The 2010 and 2012 market share data
Unlock this Answer For Free Now!
View this answer and more for free by performing one of the following actions

Scan the QR code to install the App and get 2 free unlocks

Unlock quizzes for free by uploading documents