The following graphic of PCB Failures is a _____________. 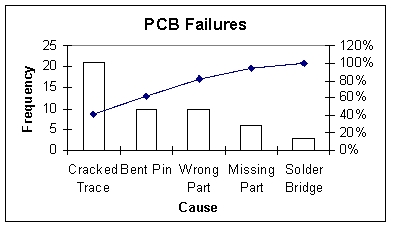
A) Scatter Plot
B) Pareto Chart
C) Pie Chart
D) Cumulative Histogram Chart
E) Line diagram
Correct Answer:
Verified
Q72: The 2010 and 2012 market share data
Q73: The 2010 and 2012 market share data
Q74: The United Nations Development Programme website provides
Q75: The following is a bar chart of
Q76: The staff of Ms.Tamara Hill,VP of Technical
Q78: A recent survey of U.S.automobile owners showed
Q79: The 2010 and 2012 market share data
Q80: The United Nations Development Programme website provides
Q81: Your company is doing market research to
Q81: Your company is doing market research to
Unlock this Answer For Free Now!
View this answer and more for free by performing one of the following actions

Scan the QR code to install the App and get 2 free unlocks

Unlock quizzes for free by uploading documents