The United Nations Development Programme website provides comparative data by country on key metrics.Two such metrics are life expectancy and expenditures on health as a percent of GDP.The table below shows data on life expectancy and health expenditures in the United States.  Which of the following scatterplots best depicts the relationship between life expectancy and
Expenditures on health as a percent of GDP?
A) 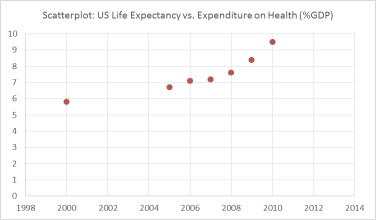
B) 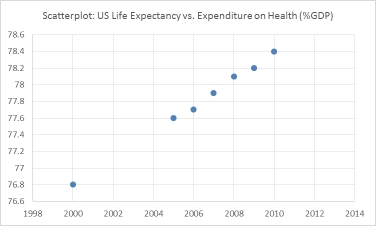
C) 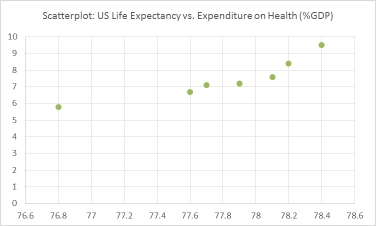
D) 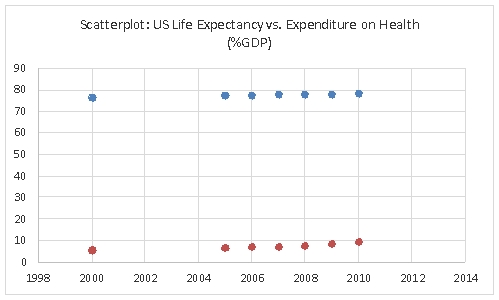
Correct Answer:
Verified
Q75: The following is a bar chart of
Q76: The staff of Ms.Tamara Hill,VP of Technical
Q77: The following graphic of PCB Failures is
Q78: A recent survey of U.S.automobile owners showed
Q79: The 2010 and 2012 market share data
Q81: Your company is doing market research to
Q81: Your company is doing market research to
Q82: Given two class intervals and their respective
Q85: The staff of Ms.Tamara Hill,VP of technical
Q88: In a frequency distribution, the first class
Unlock this Answer For Free Now!
View this answer and more for free by performing one of the following actions

Scan the QR code to install the App and get 2 free unlocks

Unlock quizzes for free by uploading documents