The following graph is a binomial distribution with n = 6. 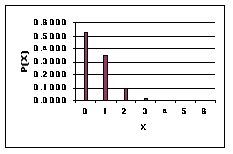 This graph reveals that ____________.
A) p > 0.5
B) p = 1.0
C) p = 0
D) p < 0.5
E) p = 1.5
Correct Answer:
Verified
Q21: A market research team compiled the following
Q23: A recent analysis of the number of
Q25: The following graph is a binomial distribution
Q27: The number of successes in a hypergeometric
Q27: A market research team compiled the following
Q28: The following graph is a binomial distribution
Q30: In a hypergeometric distribution the population, N,
Q37: In American Roulette, there are two zeroes
Q47: Twenty-five individuals are randomly selected out of
Q52: If x is a binomial random variable
Unlock this Answer For Free Now!
View this answer and more for free by performing one of the following actions

Scan the QR code to install the App and get 2 free unlocks

Unlock quizzes for free by uploading documents