The table given below shows the quantity supplied and the quantity demanded for a good at different prices. If the price of the good described in the table given below is $1.60, then there is a:
Table 4.1
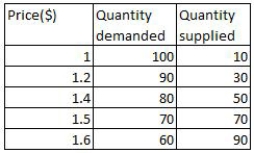
A) shortage of 30 units.
B) surplus of 30 units.
C) shortage of 20 units.
D) surplus of 20 units.
E) surplus of 10 units.
Correct Answer:
Verified
Q65: A surplus of shoes will cause:
A)a decrease
Q79: Which of the following is likely to
Q83: What is the effect of a decrease
Q87: Consider a market for cookies that is
Q90: Attempts are being made to develop a
Q91: The market for chewing gum is in
Q96: For a given upward-sloping supply curve,a decrease
Q97: The equilibrium point represents the only price-quantity
Q101: The table given below shows the quantity
Q102: The table given below shows the quantity
Unlock this Answer For Free Now!
View this answer and more for free by performing one of the following actions

Scan the QR code to install the App and get 2 free unlocks

Unlock quizzes for free by uploading documents