The table given below shows the quantity supplied and the quantity demanded for a good at different prices. If the price of the good described in the table given below is $1.50, then:
Table 4.1
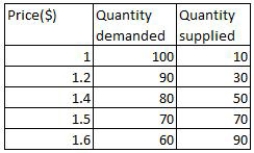
A) there is a shortage in the market.
B) there is a surplus in the market.
C) the market is in equilibrium.
D) the supply of the good increases by 30 units.
E) the demand for the good increases by 30 units.
Correct Answer:
Verified
Q64: Which of these is likely to increase
Q65: A surplus of shoes will cause:
A)a decrease
Q67: Markets reduce transactions costs:
A)by decreasing the time
Q75: When quantity demanded of a good exceeds
Q79: Which of the following is likely to
Q87: Consider a market for cookies that is
Q90: Attempts are being made to develop a
Q97: The equilibrium point represents the only price-quantity
Q102: The table given below shows the quantity
Q104: The table given below shows the quantity
Unlock this Answer For Free Now!
View this answer and more for free by performing one of the following actions

Scan the QR code to install the App and get 2 free unlocks

Unlock quizzes for free by uploading documents