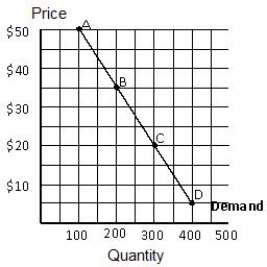
Figure 5.3 shows a linear demand curve. Between points B and C, the demand is:
Figure 5.3
A) unitary.
B) elastic.
C) inelastic.
D) perfectly elastic.
E) perfectly inelastic.
Correct Answer:
Verified
Q72: Which of the following describes a situation
Q74: Which of the following statements is not
Q75: Figure 5.3 shows a linear demand curve.
Q76: Figure 5.3 shows a linear demand curve.
Q77: Figure 5.5 shows the total revenue curve
Q80: Figure 5.3 shows a linear demand curve.
Q81: Figure 5.5 shows the total revenue curve
Q83: For which of the following is demand
Q89: A perfectly inelastic demand curve is _
A)a
Q104: The value of the price elasticity of
Unlock this Answer For Free Now!
View this answer and more for free by performing one of the following actions

Scan the QR code to install the App and get 2 free unlocks

Unlock quizzes for free by uploading documents