Figure 5.3 shows a linear demand curve. As you move from point B to point C along the demand curve, total revenue _____ and the demand is _____.
Figure 5.3
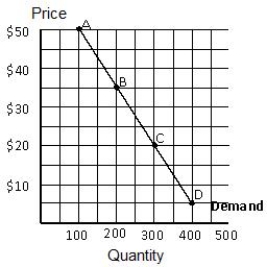
A) stays the same; unitary
B) decreases; inelastic
C) increases; elastic
D) decreases; elastic
E) increases, inelastic
Correct Answer:
Verified
Q42: The total revenue from selling trucks is
Q45: Identify a statement that is true about
Q72: Figure 5.4 shows a downward-sloping linear demand
Q72: Which of the following describes a situation
Q74: Which of the following statements is not
Q75: Figure 5.3 shows a linear demand curve.
Q77: Figure 5.5 shows the total revenue curve
Q79: Figure 5.3 shows a linear demand curve.
Q80: Figure 5.3 shows a linear demand curve.
Q81: Figure 5.5 shows the total revenue curve
Unlock this Answer For Free Now!
View this answer and more for free by performing one of the following actions

Scan the QR code to install the App and get 2 free unlocks

Unlock quizzes for free by uploading documents