The following diagram shows the market equilibrium for opera tickets. The demand curve for opera tickets is labeled D and the supply curve S. At market equilibrium, area _____ represents the consumer surplus of all buyers in the market.
Figure 6.7
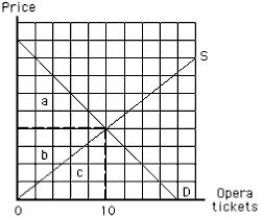
A) a
B) b
C) c
D) a + b + c
E) a + b
Correct Answer:
Verified
Q124: The following image shows the market equilibrium
Q125: If medical care is provided free of
Q126: At a zero price, the consumer surplus
Q127: If Joel buys ten floppy disks, which
Q131: Which of the following people is least
Q132: Sally wants to visit Orlando during the
Q148: Consumers derive consumer surplus when _
A)the monetary
Q150: A consumer might buy from a high-priced
Q153: The consumer surplus derived from the last
Q170: A consumer's willingness to pay additional money
Unlock this Answer For Free Now!
View this answer and more for free by performing one of the following actions

Scan the QR code to install the App and get 2 free unlocks

Unlock quizzes for free by uploading documents