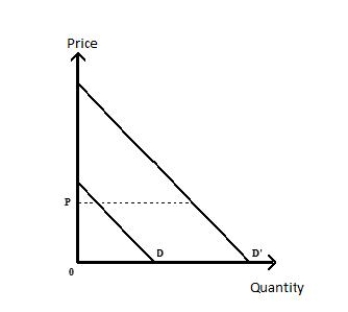
The following diagram shows Emily's demand curves for hot chocolate. On a normal day, Emily's demand curve for a cup of hot chocolate is shown as D. On a freezing day, her demand curve shifts rightward to D'. At a price P, Emily's consumer surplus on a freezing day:
Figure 6.8
A) cannot be determined without calculating her marginal valuation of a cup of hot chocolate.
B) increases significantly over her consumer surplus on a normal day.
C) will vary depending on whether hot chocolate is a normal or an inferior good.
D) increases only if her demand curve is unit-elastic.
E) decreases significantly over her consumer surplus on a normal day.
Correct Answer:
Verified
Q138: Dale is willing to pay $300 for
Q140: When consumers are required to pay a
Q141: Which of the following statements is true?
A)The
Q142: Which of the following people would least
Q143: The cost of consumption has two components:
A)the
Q144: The following graph shows the demand curves
Q145: The following graph shows the demand curves
Q146: When this market is in equilibrium, the
Q151: Fred truthfully tells a car dealer that
Q173: _ can be used to compare the
Unlock this Answer For Free Now!
View this answer and more for free by performing one of the following actions

Scan the QR code to install the App and get 2 free unlocks

Unlock quizzes for free by uploading documents