When this market is in equilibrium, the consumer surplus is shown by the area:
Figure 6.11
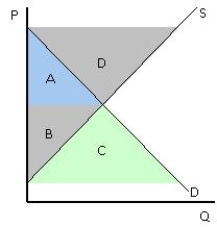
A) A.
B) A + B.
C) B.
D) C.
E) D.
Correct Answer:
Verified
Q140: When consumers are required to pay a
Q141: The following diagram shows Emily's demand curves
Q142: Which of the following people would least
Q144: The following graph shows the demand curves
Q145: The following graph shows the demand curves
Q147: Which of the following is true of
Q148: The following graph shows the demand curves
Q160: After paying the price of admission,Alan enters
Q162: Although some tastes do change over time,economists
Q173: _ can be used to compare the
Unlock this Answer For Free Now!
View this answer and more for free by performing one of the following actions

Scan the QR code to install the App and get 2 free unlocks

Unlock quizzes for free by uploading documents