Figure 7.1 shows the U-shaped cost curves for a producer. In the figure below, A is the marginal cost curve, B is the average variable cost curve, and C is the average total cost curve. The vertical distance between lines B and C at any level of output represents _____.
Figure 7.1
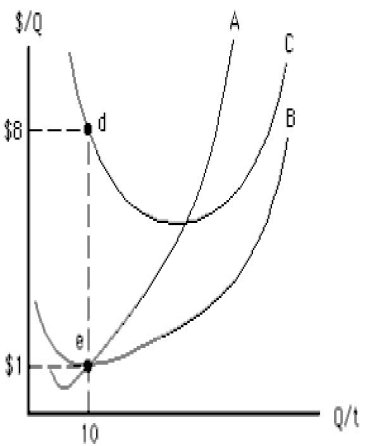
A) marginal cost
B) average total cost
C) average variable cost
D) average fixed cost
E) average marginal cost
Correct Answer:
Verified
Q93: To a firm facing constant input prices,increasing
Q96: Table 7.4 shows labor, total product, and
Q98: Table 7.4 shows labor, total product, and
Q99: A variable cost is one that changes
Q100: Table 7.3 shows the number of workers
Q102: As output rises, marginal product eventually diminishes
Q105: Figure 7.1 shows the U-shaped cost curves
Q107: If variable cost rises from $60 to
Q138: The short-run average variable cost curve _
A)is
Q155: Which of the following is true in
Unlock this Answer For Free Now!
View this answer and more for free by performing one of the following actions

Scan the QR code to install the App and get 2 free unlocks

Unlock quizzes for free by uploading documents