Figure 7.1 shows the U-shaped cost curves for a producer. In the figure below, A is the marginal cost curve, B is the average variable cost curve, and C is the average total cost curve. When output is 10, then:
Figure 7.1
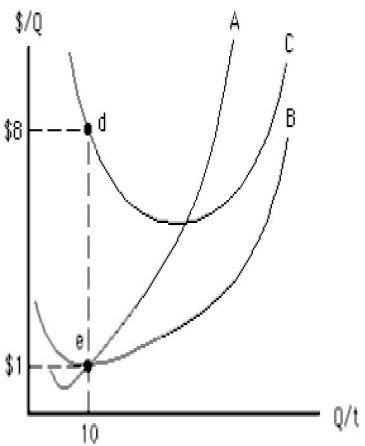
A) total cost equals $80.
B) fixed cost equals $10.
C) variable cost equals $70.
D) marginal cost equals $10.
E) fixed cost equals $7.
Correct Answer:
Verified
Q100: Table 7.3 shows the number of workers
Q101: Figure 7.1 shows the U-shaped cost curves
Q102: As output rises, marginal product eventually diminishes
Q107: If variable cost rises from $60 to
Q108: Which of the following correctly describes the
Q109: Figure 7.1 shows the U-shaped cost curves
Q123: A firm enters into a consent decree
Q130: If a firm shuts down in the
Q138: The short-run average variable cost curve _
A)is
Q155: Which of the following is true in
Unlock this Answer For Free Now!
View this answer and more for free by performing one of the following actions

Scan the QR code to install the App and get 2 free unlocks

Unlock quizzes for free by uploading documents