The following figure shows the total cost and total revenue curves of a firm. The firm maximizes profit at an output represented by _____.
Figure 8.1
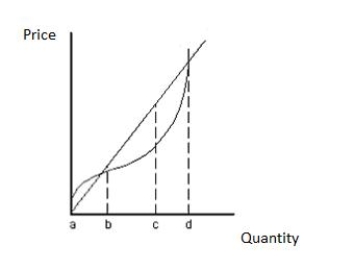
A) point a
B) point b
C) point c
D) point d
E) a point beyond point d
Correct Answer:
Verified
Q13: Individual firms in a perfectly competitive market
Q22: Suppose the equilibrium price in a perfectly
Q29: Economists assume that firms seek to _
A)maximize
Q39: In Connecticut,the market for apples is perfectly
Q51: The total revenue curve in the following
Q54: A farmer in the Midwest who produces
Q55: The perfectly competitive firewood market is composed
Q56: The table given below shows the output
Q57: The following table shows the output supplied
Q58: The perfectly competitive firewood market is composed
Unlock this Answer For Free Now!
View this answer and more for free by performing one of the following actions

Scan the QR code to install the App and get 2 free unlocks

Unlock quizzes for free by uploading documents