The total revenue curve in the following figure reflects _____.
Figure 8.1:
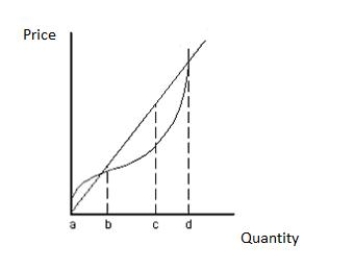
A) a constant rate of profit for the competitive firms
B) diminishing marginal revenue
C) increasing marginal revenue
D) the fact that perfectly competitive firms are price takers
E) the fact that consumers will purchase more from a firm that sells its product at higher prices
Correct Answer:
Verified
Q13: Individual firms in a perfectly competitive market
Q22: Suppose the equilibrium price in a perfectly
Q29: Economists assume that firms seek to _
A)maximize
Q35: Economic theory assumes that _
A)the goal of
Q39: In Connecticut,the market for apples is perfectly
Q47: The shape of the total cost curve
Q53: The following figure shows the total cost
Q54: A farmer in the Midwest who produces
Q55: The perfectly competitive firewood market is composed
Q56: The table given below shows the output
Unlock this Answer For Free Now!
View this answer and more for free by performing one of the following actions

Scan the QR code to install the App and get 2 free unlocks

Unlock quizzes for free by uploading documents