The shape of the total cost curve between the output levels represented by points a and b in the following figure reflects _____.
Figure 8.1:
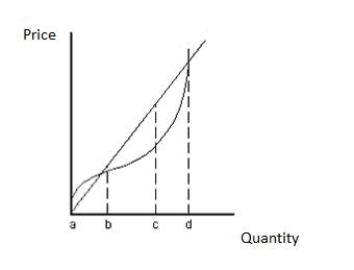
A) fixed costs
B) increasing profits
C) diminishing marginal returns
D) increasing marginal returns
E) economies of scale
Correct Answer:
Verified
Q13: Individual firms in a perfectly competitive market
Q22: Suppose the equilibrium price in a perfectly
Q29: Economists assume that firms seek to _
A)maximize
Q34: Which of the following is true of
Q35: Economic theory assumes that _
A)the goal of
Q39: In Connecticut,the market for apples is perfectly
Q41: The total revenue curve for a perfectly
Q42: The following figure shows short-run profit maximization
Q45: A perfectly competitive firm that earns an
Q51: The total revenue curve in the following
Unlock this Answer For Free Now!
View this answer and more for free by performing one of the following actions

Scan the QR code to install the App and get 2 free unlocks

Unlock quizzes for free by uploading documents