The figure below shows the cost and revenue curves for a monopolist. Assume that the monopolist does not shut down production in the short run. The profit-maximizing price and output for this non-price discriminating monopolist are:
Figure 9.4
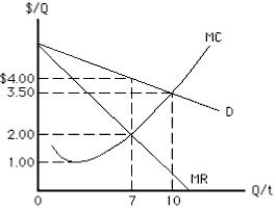
A) $4 and 7 units, respectively.
B) $3.50 and 10 units, respectively.
C) $2 and 7 units, respectively.
D) $1 and 7 units, respectively.
E) $1 and 10 units, respectively.
Correct Answer:
Verified
Q65: A monopolist is said to have market
Q76: The table below shows the demand schedule
Q77: The figure below shows the cost and
Q78: The table below shows the demand schedule
Q79: The table below shows the price and
Q82: The figure below shows the cost and
Q83: The figure below shows the cost and
Q84: Which of the following is true of
Q86: The figure below shows the cost and
Q96: A profit-maximizing monopolist that produces in the
Unlock this Answer For Free Now!
View this answer and more for free by performing one of the following actions

Scan the QR code to install the App and get 2 free unlocks

Unlock quizzes for free by uploading documents