The figure below shows the cost and revenue curves for a monopolist. The profit-maximizing output for this non-discriminating monopolist is:
Figure 9.5
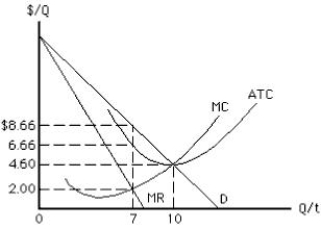
A) 0.
B) 7 units.
C) 10 units.
D) more than 10 units.
E) less than 7 units but more than 0.
Correct Answer:
Verified
Q81: The figure below shows the cost and
Q82: The figure below shows the cost and
Q83: The figure below shows the cost and
Q84: Which of the following is true of
Q87: The figure below shows the total cost
Q88: The figure below shows the cost and
Q89: The figure below shows the cost and
Q91: The figure below shows the cost and
Q92: Suppose a restaurant has a monopoly in
Q96: A profit-maximizing monopolist that produces in the
Unlock this Answer For Free Now!
View this answer and more for free by performing one of the following actions

Scan the QR code to install the App and get 2 free unlocks

Unlock quizzes for free by uploading documents