The figure below shows the cost and revenue curves for a monopolist that does not practice price discrimination. The consumer surplus at the profit-maximizing level of output is:
Figure 9.6
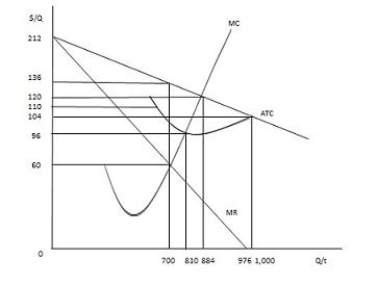
A) represented by the area under the demand curve and above the price line corresponding to $136.
B) represented by the area under the demand curve and above the line corresponding to an average total cost of $110.
C) represented by the area under the marginal revenue curve and the line corresponding to a marginal revenue of $60.
D) $0.
E) equal to total consumer expenditure.
Correct Answer:
Verified
Q81: McDonald's makes its unique McRib sandwich "available
Q88: Suppose the marginal cost for the 1,000th
Q107: Which of the following is true for
Q109: A monopolist is likely to overcome a
Q109: If a monopolist that does not practice
Q110: Barriers to entry:
A)cause monopolies to experience diseconomies
Q113: The figure below shows the cost and
Q116: When compared to firms in perfect competition,monopolists
Q117: Which of the following factors explain the
Q162: The supply curve for a monopolist
A)is its
Unlock this Answer For Free Now!
View this answer and more for free by performing one of the following actions

Scan the QR code to install the App and get 2 free unlocks

Unlock quizzes for free by uploading documents