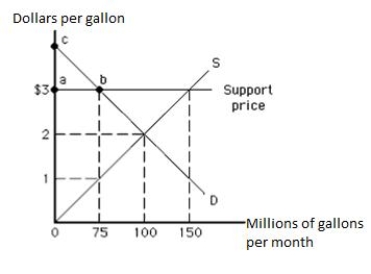
The following graph shows the market for milk. Suppose the government introduces a variety of policies that set floor prices for milk at $3. Without government intervention, the market price of milk would average $2 per gallon for a market quantity of 100 million gallons per month. In the graph below, triangle abc represents the consumer surplus at the support price.
Figure 16.1
Correct Answer:
Verified
Q10: A good that is both rival and
Q20: A good that is nonrival but exclusive
Q121: Taxing people according to their marginal valuations
Q182: Decreasing tax rates would likely increase activities
Q183: Special-interest legislation generally leads to an increase
Q185: Dairy price supports result in a redistribution
Q188: Budget maximization by government bureaus results in
Q189: Special-interest legislation in a representative democracy benefits
Q191: Traditional public-goods legislation usually has a negative
Q192: Taxpayers and consumers end up paying for
Unlock this Answer For Free Now!
View this answer and more for free by performing one of the following actions

Scan the QR code to install the App and get 2 free unlocks

Unlock quizzes for free by uploading documents