The following graph shows the market for a good. Suppose the government introduces a variety of policies that set floor prices for the good at $c. The quantity of the good demanded by the consumers at the price floor is _____.
Figure 16.3
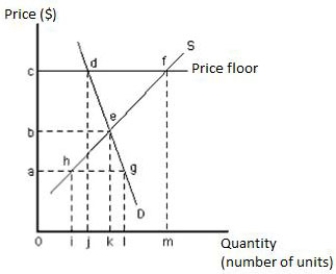
A) i units
B) j units
C) k units
D) l units
E) m units
Correct Answer:
Verified
Q91: Payments higher than necessary to call forth
Q92: The following image shows a market equilibrium.
Q94: Which of the following is true of
Q97: When the support price for a good
Q98: Resources employed to persuade government to redistribute
Q99: The following image shows a market. If
Q101: Which of the following transactions is most
Q102: The purpose of a political action committee
Q118: Special-interest groups have little incentive to _
A)earn
Q120: Direct transfer programs _
A)are generally less efficient
Unlock this Answer For Free Now!
View this answer and more for free by performing one of the following actions

Scan the QR code to install the App and get 2 free unlocks

Unlock quizzes for free by uploading documents