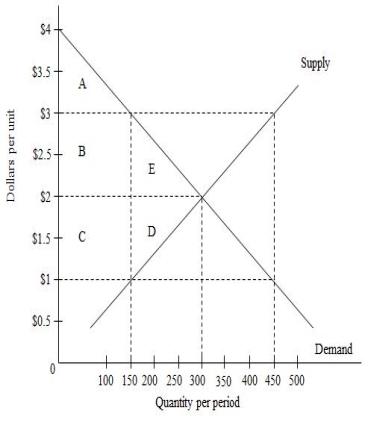
The following image shows a market equilibrium. Suppose the government imposes a price floor of $3 on each unit of the good sold in the market. Which of the following is true in such a case?
Figure 16.4
A) The cost to consumer-taxpayers increases by $300.
B) The cost to consumer-taxpayers increases by $600.
C) The cost to consumer-taxpayers decreases by $300.
D) The cost to consumer-taxpayers decreases by $600.
E) The cost to consumer-taxpayers decreases by $150.
Correct Answer:
Verified
Q87: The following graph shows the market for
Q89: The following graph shows the market for
Q90: The following image shows a market. If
Q91: Payments higher than necessary to call forth
Q94: Which of the following is true of
Q96: The following graph shows the market for
Q97: When the support price for a good
Q106: A lobbyist for the coal industry asks
Q118: Special-interest groups have little incentive to _
A)earn
Q120: Direct transfer programs _
A)are generally less efficient
Unlock this Answer For Free Now!
View this answer and more for free by performing one of the following actions

Scan the QR code to install the App and get 2 free unlocks

Unlock quizzes for free by uploading documents