The following image shows a market. If there is no government intervention in the market, the consumer surplus is represented by the area equal to _____.
Figure 16.4
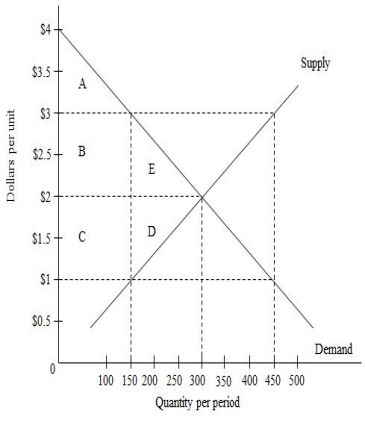
A) A + B + C
B) A+ B + E
C) B + C + D
D) B + E + D
E) E + D
Correct Answer:
Verified
Q85: The following graph shows the market for
Q86: The total welfare cost of a monopoly
Q87: The following graph shows the market for
Q89: The following graph shows the market for
Q91: Payments higher than necessary to call forth
Q92: The following image shows a market equilibrium.
Q94: Which of the following is true of
Q97: When the support price for a good
Q106: A lobbyist for the coal industry asks
Q120: Direct transfer programs _
A)are generally less efficient
Unlock this Answer For Free Now!
View this answer and more for free by performing one of the following actions

Scan the QR code to install the App and get 2 free unlocks

Unlock quizzes for free by uploading documents