The following graph shows the market for a good. Suppose the government introduces a variety of policies that set floor prices for the good at $c. Which of the following represents the loss of consumer surplus in this case?
Figure 16.3
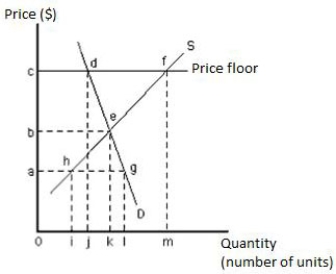
A) Area bcde
B) Area ihgl
C) Area dfe
D) Area aglo
E) Area abeg
Correct Answer:
Verified
Q77: The hiring of a brilliant tax lawyer
Q85: The following graph shows the market for
Q86: The total welfare cost of a monopoly
Q87: The following graph shows the market for
Q90: The following image shows a market. If
Q91: Payments higher than necessary to call forth
Q92: The following image shows a market equilibrium.
Q94: Which of the following is true of
Q97: When the support price for a good
Q106: A lobbyist for the coal industry asks
Unlock this Answer For Free Now!
View this answer and more for free by performing one of the following actions

Scan the QR code to install the App and get 2 free unlocks

Unlock quizzes for free by uploading documents