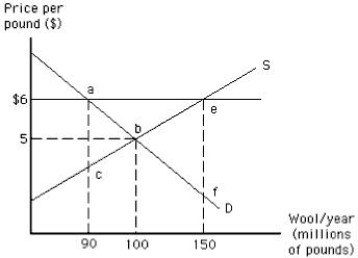
The following graph shows the market for wool. Suppose the government introduces a variety of policies that set floor prices for wool at $6. If the government decides to buy the surplus wool generated by the price floor, then they have to spend _____ per year on wool.
Figure 16.2
A) $540 million
B) $360 million
C) $600 million
D) $900 million
E) $300 million
Correct Answer:
Verified
Q77: The hiring of a brilliant tax lawyer
Q80: The following graph shows the market for
Q81: The following graph shows the market for
Q83: Rent seekers are those who:
A)support the legislation
Q86: The total welfare cost of a monopoly
Q87: The following graph shows the market for
Q89: The following graph shows the market for
Q90: The following image shows a market. If
Q101: An important feature of representative democracy is
Q106: A lobbyist for the coal industry asks
Unlock this Answer For Free Now!
View this answer and more for free by performing one of the following actions

Scan the QR code to install the App and get 2 free unlocks

Unlock quizzes for free by uploading documents