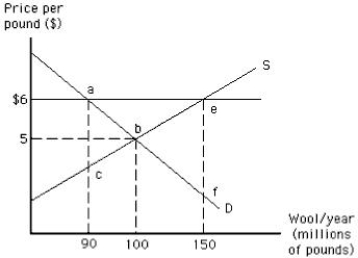
The following graph shows the market for wool. Suppose the government introduces a variety of policies that set floor prices for wool at $6. As a result of the price support, _____ of surplus wool is generated.
Figure 16.2
A) 100 million pounds
B) 60 million pounds
C) 150 million pounds
D) 90 million pounds
E) 10 million pounds
Correct Answer:
Verified
Q76: The following graph shows the market for
Q77: The hiring of a brilliant tax lawyer
Q78: With special-interest legislation, _.
A)benefits are concentrated but
Q79: If general tax revenues were used to
Q80: The following graph shows the market for
Q82: Legislators often have difficulty passing legislation with
Q83: Rent seekers are those who:
A)support the legislation
Q85: The following graph shows the market for
Q86: The total welfare cost of a monopoly
Q101: An important feature of representative democracy is
Unlock this Answer For Free Now!
View this answer and more for free by performing one of the following actions

Scan the QR code to install the App and get 2 free unlocks

Unlock quizzes for free by uploading documents