The following graph shows the market for milk. Suppose the government introduces a variety of policies that set floor prices for milk at $3. Without government intervention, the market price of milk would average $2 per gallon for a market quantity of 100 million gallons per month. In such a case, total outlays by consumer-taxpayers equal _____, though they consume _____ fewer gallons.
Figure 16.1
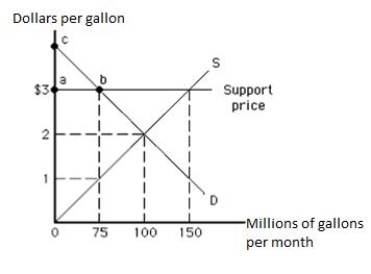
A) $225 million; 75 million
B) $3 million; 150 million
C) $100 million; 50 million
D) $450 million; 25 million
E) $2 million; 100 million
Correct Answer:
Verified
Q21: An example of competing-interest legislation is
A)a quota
Q76: The following graph shows the market for
Q77: The hiring of a brilliant tax lawyer
Q78: With special-interest legislation, _.
A)benefits are concentrated but
Q79: If general tax revenues were used to
Q81: The following graph shows the market for
Q82: Legislators often have difficulty passing legislation with
Q83: Rent seekers are those who:
A)support the legislation
Q85: The following graph shows the market for
Q101: An important feature of representative democracy is
Unlock this Answer For Free Now!
View this answer and more for free by performing one of the following actions

Scan the QR code to install the App and get 2 free unlocks

Unlock quizzes for free by uploading documents