The following graph shows market equilibrium in the presence of an externality in an economy. The socially efficient level of output is _____.
Figure 17.1
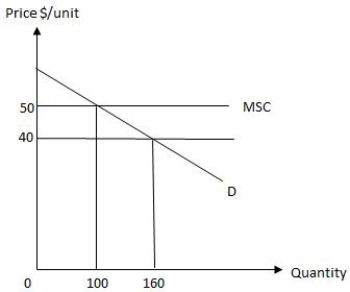
A) 0 units
B) 100 units
C) between 0 and 100 units
D) 160 units
E) between 100 and 160 units
Correct Answer:
Verified
Q30: Suppose a city builds a new park
Q32: Open-access resources tend to be _
A)conserved.
B)taxed.
C)overused.
D)efficiently used.
E)underutilized.
Q39: Which of the following is true of
Q50: To solve the common-pool problem in fishing,
Q51: The following graph shows equilibrium in a
Q52: Which of the following is not an
Q55: The following graph shows market equilibrium in
Q56: The following graph shows equilibrium in a
Q57: Open-access resources are owned by:
A)every individual in
Q58: Which of the following is an example
Unlock this Answer For Free Now!
View this answer and more for free by performing one of the following actions

Scan the QR code to install the App and get 2 free unlocks

Unlock quizzes for free by uploading documents