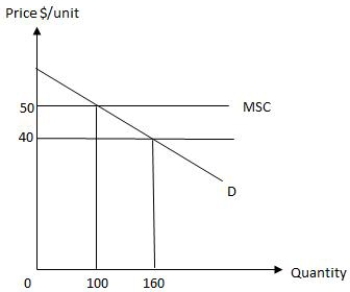
The following graph shows equilibrium in a market in the presence of an externality. The amount by which the total social cost of producing the private equilibrium level of output exceeds the total social benefit is _____.
Figure 17.1
A) $3,000
B) $1,000
C) $5,000
D) $1,600
E) $1,400
Correct Answer:
Verified
Q30: Suppose a city builds a new park
Q37: The common-pool problem arises _
A)when goods are
Q51: The following graph shows equilibrium in a
Q52: Which of the following is not an
Q53: The following graph shows market equilibrium in
Q55: The following graph shows market equilibrium in
Q57: Open-access resources are owned by:
A)every individual in
Q58: Which of the following is an example
Q59: The following graph shows market equilibrium in
Q61: The marginal external cost is:
A)the additional cost
Unlock this Answer For Free Now!
View this answer and more for free by performing one of the following actions

Scan the QR code to install the App and get 2 free unlocks

Unlock quizzes for free by uploading documents