The following graph shows the market for pollution rights in an economy. The optimal level of air quality is ______.
Figure 17.3
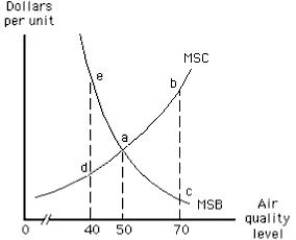
A) 0
B) 40
C) 50
D) 70
E) greater than 70
Correct Answer:
Verified
Q45: If the marginal social cost of producing
Q62: The optimal level of air pollution by
Q70: Marginal social cost is equal to _
A)the
Q74: Society's total cost of producing a good
Q77: The socially optimal level of output of
Q78: When using the traditional command-and-control approach to
Q82: The following graph shows the market for
Q82: According to the Coase theorem,if the appropriate
Q84: The optimal level of air quality will
Q88: According to the Coase theorem,there will be
Unlock this Answer For Free Now!
View this answer and more for free by performing one of the following actions

Scan the QR code to install the App and get 2 free unlocks

Unlock quizzes for free by uploading documents