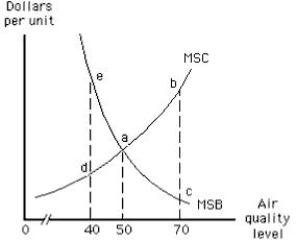
The following graph shows the market for pollution rights in an economy. The social welfare loss that results from 70 units of air quality is shown by area _____.
Figure 17.3
A) edcb
B) eda
C) bac
D) adc
E) eab
Correct Answer:
Verified
Q62: The optimal level of air pollution by
Q77: The socially optimal level of output of
Q78: When using the traditional command-and-control approach to
Q79: The following graph shows the market for
Q82: According to the Coase theorem,if the appropriate
Q84: The optimal level of air quality will
Q86: Fishing, lumbering, tourism, and city buildings in
Q87: The Coase theorem argues that the assignment
Q88: According to the Coase theorem,there will be
Q97: Markets fail when externalities are present _
A)because
Unlock this Answer For Free Now!
View this answer and more for free by performing one of the following actions

Scan the QR code to install the App and get 2 free unlocks

Unlock quizzes for free by uploading documents