The following graph shows the market for pollution rights. Which of the following could not have caused an increase in the demand for pollution rights?
Figure 17.4
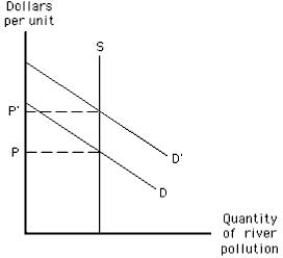
A) An increase in the number of polluting firms
B) An increase in the ability of the firm to absorb pollutants
C) A decrease in the cost of pollution abatement equipment
D) The ability of existing firms to sell pollution rights at a price lower than the market price.
E) The subsidy provided by the government on the price of pollution rights
Correct Answer:
Verified
Q84: According to the Coase theorem,_
A)government regulation is
Q89: The marginal social benefit curve for water
Q97: A metal-stamping factory moves next to a
Q98: The following graph shows the market for
Q99: A meditation class meets on the second
Q102: A major source of water pollution in
Q103: The following graph shows the market for
Q124: Control of water pollution from pesticide runoff
Q130: The Clean Air Act of 1970 _
A)set
Q131: The Clean Air Act of 1970 has
Unlock this Answer For Free Now!
View this answer and more for free by performing one of the following actions

Scan the QR code to install the App and get 2 free unlocks

Unlock quizzes for free by uploading documents