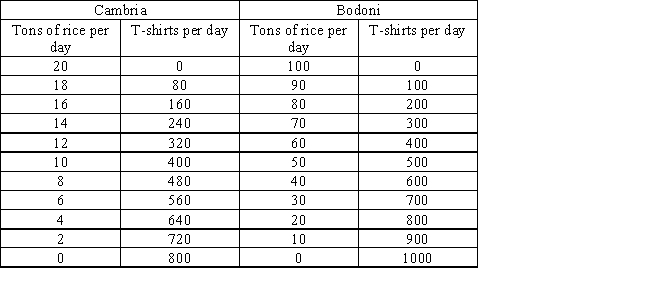
The following table shows per-day production data of rice and T-shirts for two countries, Cambria and Bodoni. Based on the table, it can be said that the opportunity cost of 1 T-shirt in Cambria is _____.
Table 19.1
A) 4 tons of rice
B) 0.5 ton of rice
C) 0.75 ton of rice
D) 0.025 ton of rice
E) 2 tons of rice
Correct Answer:
Verified
Q33: Which of the following reasons best explains
Q35: Which of the following reasons best explains
Q36: Which of the following reasons explains why
Q39: One reason for international specialization is:
A)a high
Q42: Economies of scale in the production of
Q47: Which of the following is not a
Q73: The following table shows the demand, supply,
Q74: The following table shows per-day production data
Q75: The following graph shows the market equilibrium
Q76: The following table shows the demand, supply,
Unlock this Answer For Free Now!
View this answer and more for free by performing one of the following actions

Scan the QR code to install the App and get 2 free unlocks

Unlock quizzes for free by uploading documents