The following graph shows the market equilibrium for corn in the United States. If the world price of corn is $2 and there are no trade restrictions, the United States will:
Figure 19.1
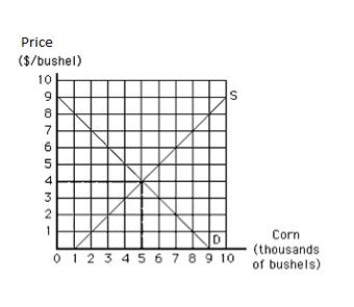
A) produce 3,000 bushels of corn, consume 7,000 bushels of corn, and import 4,000 bushels of corn.
B) produce 3,000 bushels of corn, consume 7,000 bushels of corn, and export 4,000 bushels of corn.
C) have an excess supply of corn.
D) produce 7,000 bushels of corn.
E) produce 5,000 bushels of corn, consume 7,000 bushels of corn, and import 2,000 bushels of corn.
Correct Answer:
Verified
Q39: One reason for international specialization is:
A)a high
Q42: Economies of scale in the production of
Q54: If there are no trade restrictions,a country
Q70: Differences in tastes among nations
A)make gains from
Q71: The following table shows per-day production data
Q73: The following table shows the demand, supply,
Q74: The following table shows per-day production data
Q76: The following table shows the demand, supply,
Q77: The following graph shows the market equilibrium
Q78: The following table shows per-day production data
Unlock this Answer For Free Now!
View this answer and more for free by performing one of the following actions

Scan the QR code to install the App and get 2 free unlocks

Unlock quizzes for free by uploading documents