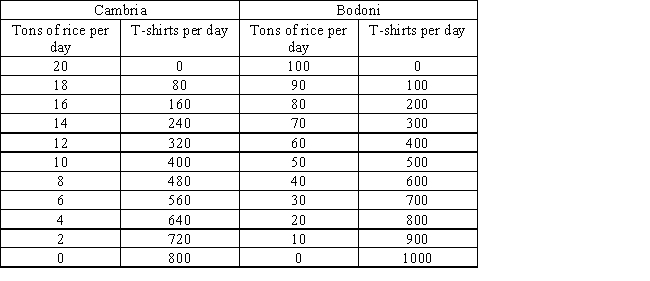
The following table shows per-day production data of rice and T-shirts for two countries, Cambria and Bodoni. Based on the table, it can be said that the opportunity cost of 1 ton of rice in Cambria is _____.
Table 19.1
A) 3 T-shirts
B) 10 T-shirts
C) 20 T-shirts
D) 30 T-shirts
E) 40 T-shirts
Correct Answer:
Verified
Q54: If there are no trade restrictions,a country
Q57: A charge levied on imports in terms
Q70: Differences in tastes among nations
A)make gains from
Q73: The following table shows the demand, supply,
Q74: The following table shows per-day production data
Q75: The following graph shows the market equilibrium
Q76: The following table shows the demand, supply,
Q77: The following graph shows the market equilibrium
Q81: The following graph shows the supply of
Q82: The following graph shows U.S. demand for
Unlock this Answer For Free Now!
View this answer and more for free by performing one of the following actions

Scan the QR code to install the App and get 2 free unlocks

Unlock quizzes for free by uploading documents