The following graph shows the supply of and demand for baseballs in the United States. If the world price is $3 per baseball and a tariff of $1 per baseball is imposed, then the number of baseballs imported is _____.
Figure 19.3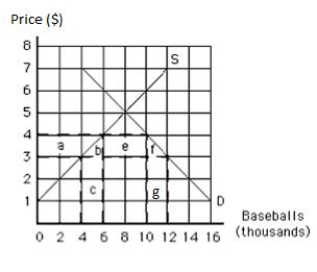
A) 4,000
B) 6,000
C) 8,000
D) 10,000
E) 12,000
Correct Answer:
Verified
Q43: Unless there are barriers to prevent free
Q54: If there are no trade restrictions,a country
Q57: A charge levied on imports in terms
Q70: Differences in tastes among nations
A)make gains from
Q76: The following table shows the demand, supply,
Q77: The following graph shows the market equilibrium
Q78: The following table shows per-day production data
Q82: The following graph shows U.S. demand for
Q85: The following graph shows the supply of
Q86: The following graph shows the demand for
Unlock this Answer For Free Now!
View this answer and more for free by performing one of the following actions

Scan the QR code to install the App and get 2 free unlocks

Unlock quizzes for free by uploading documents