The following graph shows the supply of and demand for baseballs in the United States. If the world price of a baseball is $3, then the quantity of baseballs demanded is _____.
Figure 19.3
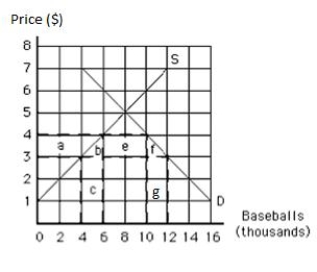
A) 4,000
B) 6,000
C) 8,000
D) 10,000
E) 12,000
Correct Answer:
Verified
Q48: When a country imposes a per-unit tariff
Q59: The world demand for and the world
Q86: The difference between the effects of an
Q91: The following graph shows the supply of
Q92: The following graph shows U.S. demand for
Q93: The following graph shows U.S. demand for
Q95: The following image shows the market for
Q98: The following graph shows the supply of
Q99: The following graph shows U.S. demand for
Q100: The following graph shows the supply of
Unlock this Answer For Free Now!
View this answer and more for free by performing one of the following actions

Scan the QR code to install the App and get 2 free unlocks

Unlock quizzes for free by uploading documents