The following graph shows the demand for and the supply of a good in a country. If the world price of the good is $2.00 per unit and an import quota of 50 units per month is imposed, then:
Figure 19.6
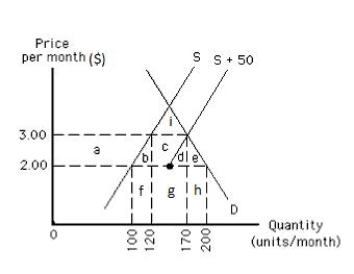
A) domestic production will increase from 100 to 200 units per month.
B) imports will increase from 25 to 50 units per month.
C) domestic production will increase from 100 to 175 units per month.
D) domestic production will increase from 100 to 125 units per month.
E) domestic production will increase from 100 to 150 units per month.
Correct Answer:
Verified
Q61: An effective import quota:
A)lowers the price of
Q75: A legal limit on the amount of
Q85: Which of the following is a type
Q86: The difference between the effects of an
Q92: Which of the following is not a
Q95: Which of the following is not correct
Q96: If quota rights accrue to foreigners,then _.
A)the
Q99: The following graph shows U.S. demand for
Q100: The following graph shows the supply of
Q103: The following graph shows the demand for
Unlock this Answer For Free Now!
View this answer and more for free by performing one of the following actions

Scan the QR code to install the App and get 2 free unlocks

Unlock quizzes for free by uploading documents