The following data were collected under conditions indicated in the graph below during the time period of 0-5 seconds.Upon plotting the Lineweaver-Burk plot,the information given in the table below was determined.Based on this available information which of the following is FALSE?
X-intercept - 0.002 (Units on the x-axis are 1/M)
Y-intercept 0.005 (Units on the y-axis are 1/s)
Slope 2.50 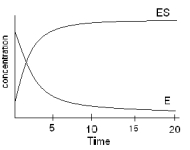
A) The Vmax equals 200 M/s
B) The Ks equals 500 M
C) The kapp equals 200 per second
D) The data was collected prior to reaching steady state.
E) The kcat cannot be determined for this information.
Correct Answer:
Verified
Q44: From the graph below plotting data that
Q45: From the graph below plotting data that
Q46: Following several experiments,the data presented on the
Q47: Based on the figure in the question
Q48: At substrate concentrations much lower than the
Q49: Based on the figures below,which of the
Q50: Enzyme E is responsible for conversion
Q52: An extremely efficient enzyme called "efficase" catalyzes
Q53: A new drug has been discovered which
Q54: A lab recently developed a new drug
Unlock this Answer For Free Now!
View this answer and more for free by performing one of the following actions

Scan the QR code to install the App and get 2 free unlocks

Unlock quizzes for free by uploading documents