Figure 8-4 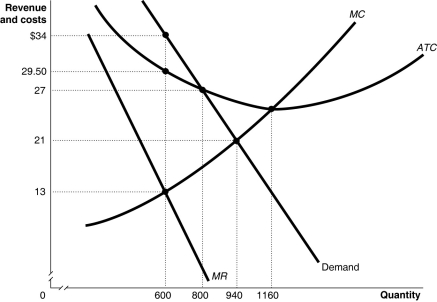 Figure 8-4 shows the demand and cost curves for a monopolist.
-Refer to Figure 8-4.What is the amount of the monopoly's total cost of production?
A) $21 600
B) $17 700
C) $9340
D) $7800
Correct Answer:
Verified
Q82: Table 8-2 Q85: Figure 8.4 Q86: Figure 8.3 Q88: Figure 8-3 Q89: Long-run economic profits would most likely exist Q97: How does a network externality serve as Q111: A price maker is Q112: A monopoly firm's demand curve Q122: Wendell can sell five motor homes per Q126: Firms that face downward-sloping demand curves for Unlock this Answer For Free Now! View this answer and more for free by performing one of the following actions Scan the QR code to install the App and get 2 free unlocks Unlock quizzes for free by uploading documents
![]()
![]()
![]()
![]()
A)a person who actively
A)is the same

