Figure 11-6 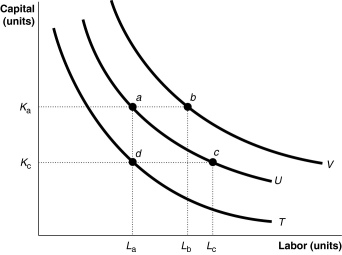
-Refer to Figure 11-6.The movement from isoquant T to isoquant U depicts
A) a change in preferences with regards to input usage.
B) an increase in the cost of production.
C) an increase in output.
D) an increase in labor usage holding capital and output constant.
Correct Answer:
Verified
Q148: Suppose Argyle Sachs has to choose between
Q153: Figure 11-6 Q154: Figure 11-7 Q264: The slope of an isoquant measures Q267: What are economies of scale? What are Q269: Higher isocost lines correspond to higher Q275: If the long-run average total cost curve Q278: What is the difference between total cost Q286: Suppose the price of capital and labor Q297: You own a business that answers telephone![]()
![]()
A)the price
A)profits.
B)total costs
Unlock this Answer For Free Now!
View this answer and more for free by performing one of the following actions

Scan the QR code to install the App and get 2 free unlocks

Unlock quizzes for free by uploading documents