Figure 11-7 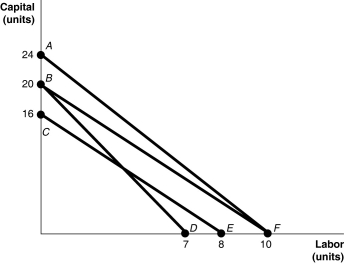
-Refer to Figure 11-7.The lines shown in the diagram are isocost lines.Which of the following shows an increase in the price of labor while the price of capital remains unchanged?
A) the movement from AF to BD
B) the movement from AF to CE
C) the movement from BF to BD
D) the movement from BF to CE
Correct Answer:
Verified
Q149: Figure 11-6 Q153: Figure 11-6 Q155: Due to a downturn in business and Q159: Figure 11-7 Q262: An isocost line shows Q267: What are economies of scale? What are Q274: The marginal rate of technical substitution is Q275: If the long-run average total cost curve Q277: An isoquant shows Q278: What is the difference between total cost Unlock this Answer For Free Now! View this answer and more for free by performing one of the following actions Scan the QR code to install the App and get 2 free unlocks Unlock quizzes for free by uploading documents![]()
![]()
![]()
A)all the possible combinations
A)the
A)the combinations of two goods

