Figure 2-1 shows the production possibilities curve of an economy that produces bread and wine. The economy was operating at full employment, and then, the workers in the bread industry were laid off. This change could be portrayed in the movement from:Figure 2-1 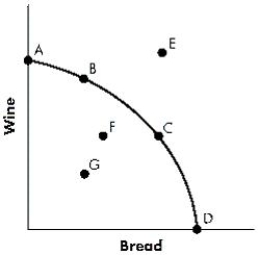
A) A to B.
B) B to E.
C) C to F.
D) G to F.
E) B to C.
Correct Answer:
Verified
Q58: Milk at a local grocery store is
Q59: An advantage of specialization is that it:
A)reduces
Q60: Country A has a comparative advantage over
Q61: Figure 2-2 shows the production possibilities curve
Q62: A production possibilities curve is negatively sloped
Q64: Figure 2-2 shows the production possibilities curve
Q65: Economic efficiency is defined as:
A)the maximization of
Q66: If additional units of output could be
Q67: Which of the following distinguishes a "straight-line"
Q68: The production possibilities curve illustrates:
A)the minimum quantity
Unlock this Answer For Free Now!
View this answer and more for free by performing one of the following actions

Scan the QR code to install the App and get 2 free unlocks

Unlock quizzes for free by uploading documents