Figure 2-2 shows the production possibilities curve of an economy in the production of consumption goods and capital goods. Considering only points on the frontier, the economy will experience the least amount of economic growth over time, ceteris paribus, if it chooses to produce at:Figure 2-2 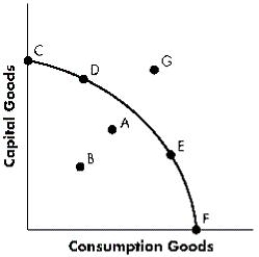
A) Point D.
B) Point C.
C) Point F.
D) Point E.
E) Point A.
Correct Answer:
Verified
Q59: An advantage of specialization is that it:
A)reduces
Q60: Country A has a comparative advantage over
Q61: Figure 2-2 shows the production possibilities curve
Q62: A production possibilities curve is negatively sloped
Q63: Figure 2-1 shows the production possibilities curve
Q65: Economic efficiency is defined as:
A)the maximization of
Q66: If additional units of output could be
Q67: Which of the following distinguishes a "straight-line"
Q68: The production possibilities curve illustrates:
A)the minimum quantity
Q69: Figure 2-1 shows the production possibilities curve
Unlock this Answer For Free Now!
View this answer and more for free by performing one of the following actions

Scan the QR code to install the App and get 2 free unlocks

Unlock quizzes for free by uploading documents